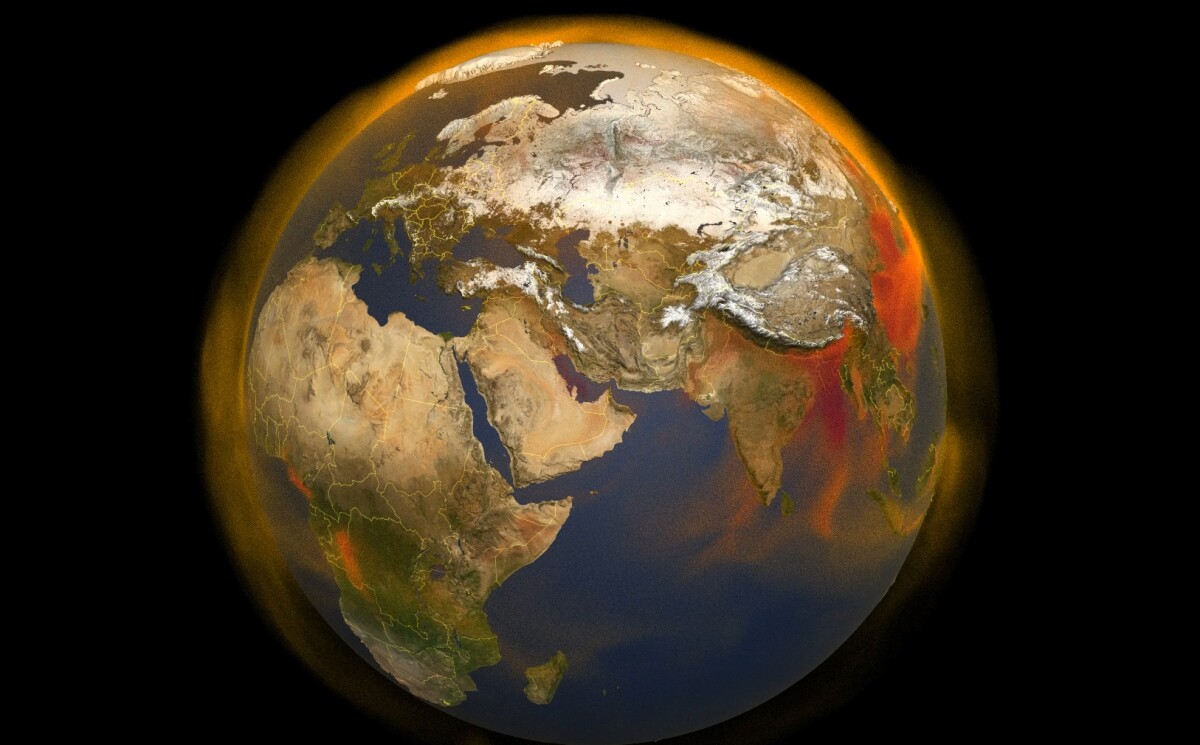
Methane is a highly potent greenhouse gas that can come from all kinds of places, including industrial facilities, agriculture, the production of oil and gas, and natural sources like wetlands and bodies of water. NASA has developed a new 3D map to not only keep track of its sources but follow its movement as it builds up and travels in the atmosphere, offering a new tool in the efforts to mitigate its impacts.
“Similar to carbon dioxide, human activity over long time periods is increasing atmospheric methane concentrations faster than the removal from natural ‘sinks’ can offset it,” says Abhishek Chatterjee, a carbon cycle scientist at NASA’s Goddard Space Flight Center. “As human populations continue to grow, changes in energy use, agriculture and rice cultivation, [and] livestock raising will influence methane emissions. However, it’s difficult to predict future trends due to both lack of measurements and incomplete understanding of the carbon-climate feedbacks.”
This need for a more complete picture of how methane is building up and contributing to global warming is a pressing one. According to NASA, methane concentration in the atmosphere has more than doubled since the Industrial Revolution and, molecule for molecule, it’s far more effective at trapping heat than carbon dioxide. In all, the agency calculates that methane is responsible for between 20 to 30 percent of the planet’s rising temperatures so far.
The agency’s new 3D map was put together using methane data gathered by satellites and the emissions inventories of different countries. This was combined with computer modeling that calculates methane emissions from natural sources such as types of wetlands and simulates the atmospheric processes that break down methane. The team then employed a weather model to see how winds influence the movement of the gas through the atmosphere over time.

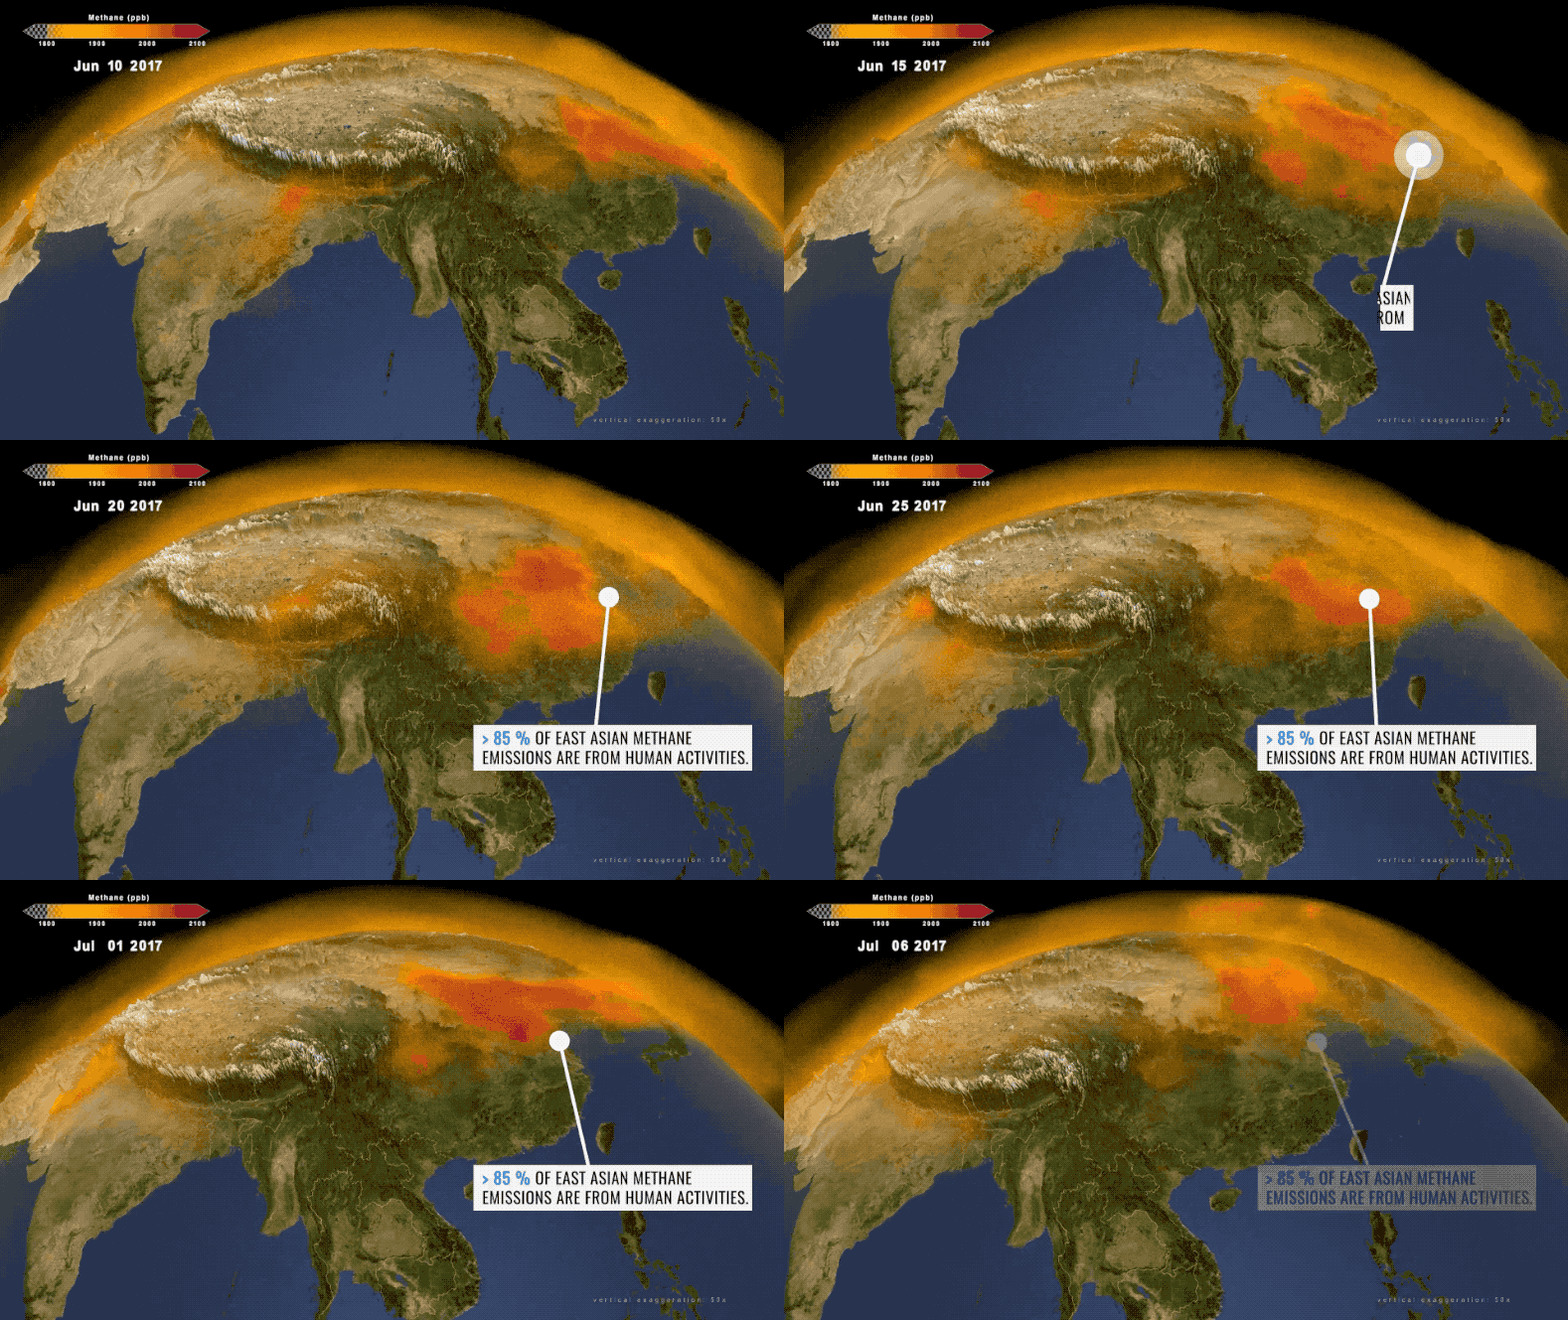
This global picture of methane revealed a few interesting insights. At least 60 percent of methane coming from the world’s wetlands originates in the tropics, while waste disposal is driving a 1.5 percent increase in methane emissions each year from southern Asia. Meanwhile, 70 percent of the methane from the Arctic was revealed to come from natural sources, while in Eastern Asia it is very much the opposite, with 85 percent coming from human activities.
“There’s an urgency in understanding where the sources are coming from so that we can be better prepared to mitigate methane emissions where there are opportunities to do so,” says research scientist Ben Poulter at NASA’s Goddard Space Flight Center in Greenbelt, Maryland.
You can hear from the team in the video below.
NASA Models Methane Sources, Movement Around Globe
Source: NASA
–
(For the source of this, and many other equally interesting articles, and to see all five images associated with it, please visit: https://newatlas.com/environment/3d-nasa-map-methane-atmosphere/)


